
How I'm analysing F1 Telemetry using Python
The next step in building the ultimate Python project for F1 Fans!

Last week I shared my latest project, F1 Race Replay, a tool that enables you to watch Formula 1 races from above.
In my previous newsletter post, I outlined what the future of the project looks like and the features that I’d like to prioritise.
So this week, I made a start by adding Qualifying telemetry analysis.
Now you may be thinking:
“Tom, why didn’t you just add the track map showing the cars going around the track during Qualifying?”
Two reasons:
I wanted to go the extra mile (pun intended). 😉
The real importance of qualifying isn’t about where everyone else is on the circuit, it’s about how each driver performs during their lap as they attempt to squeeze every millisecond of time out of the car.
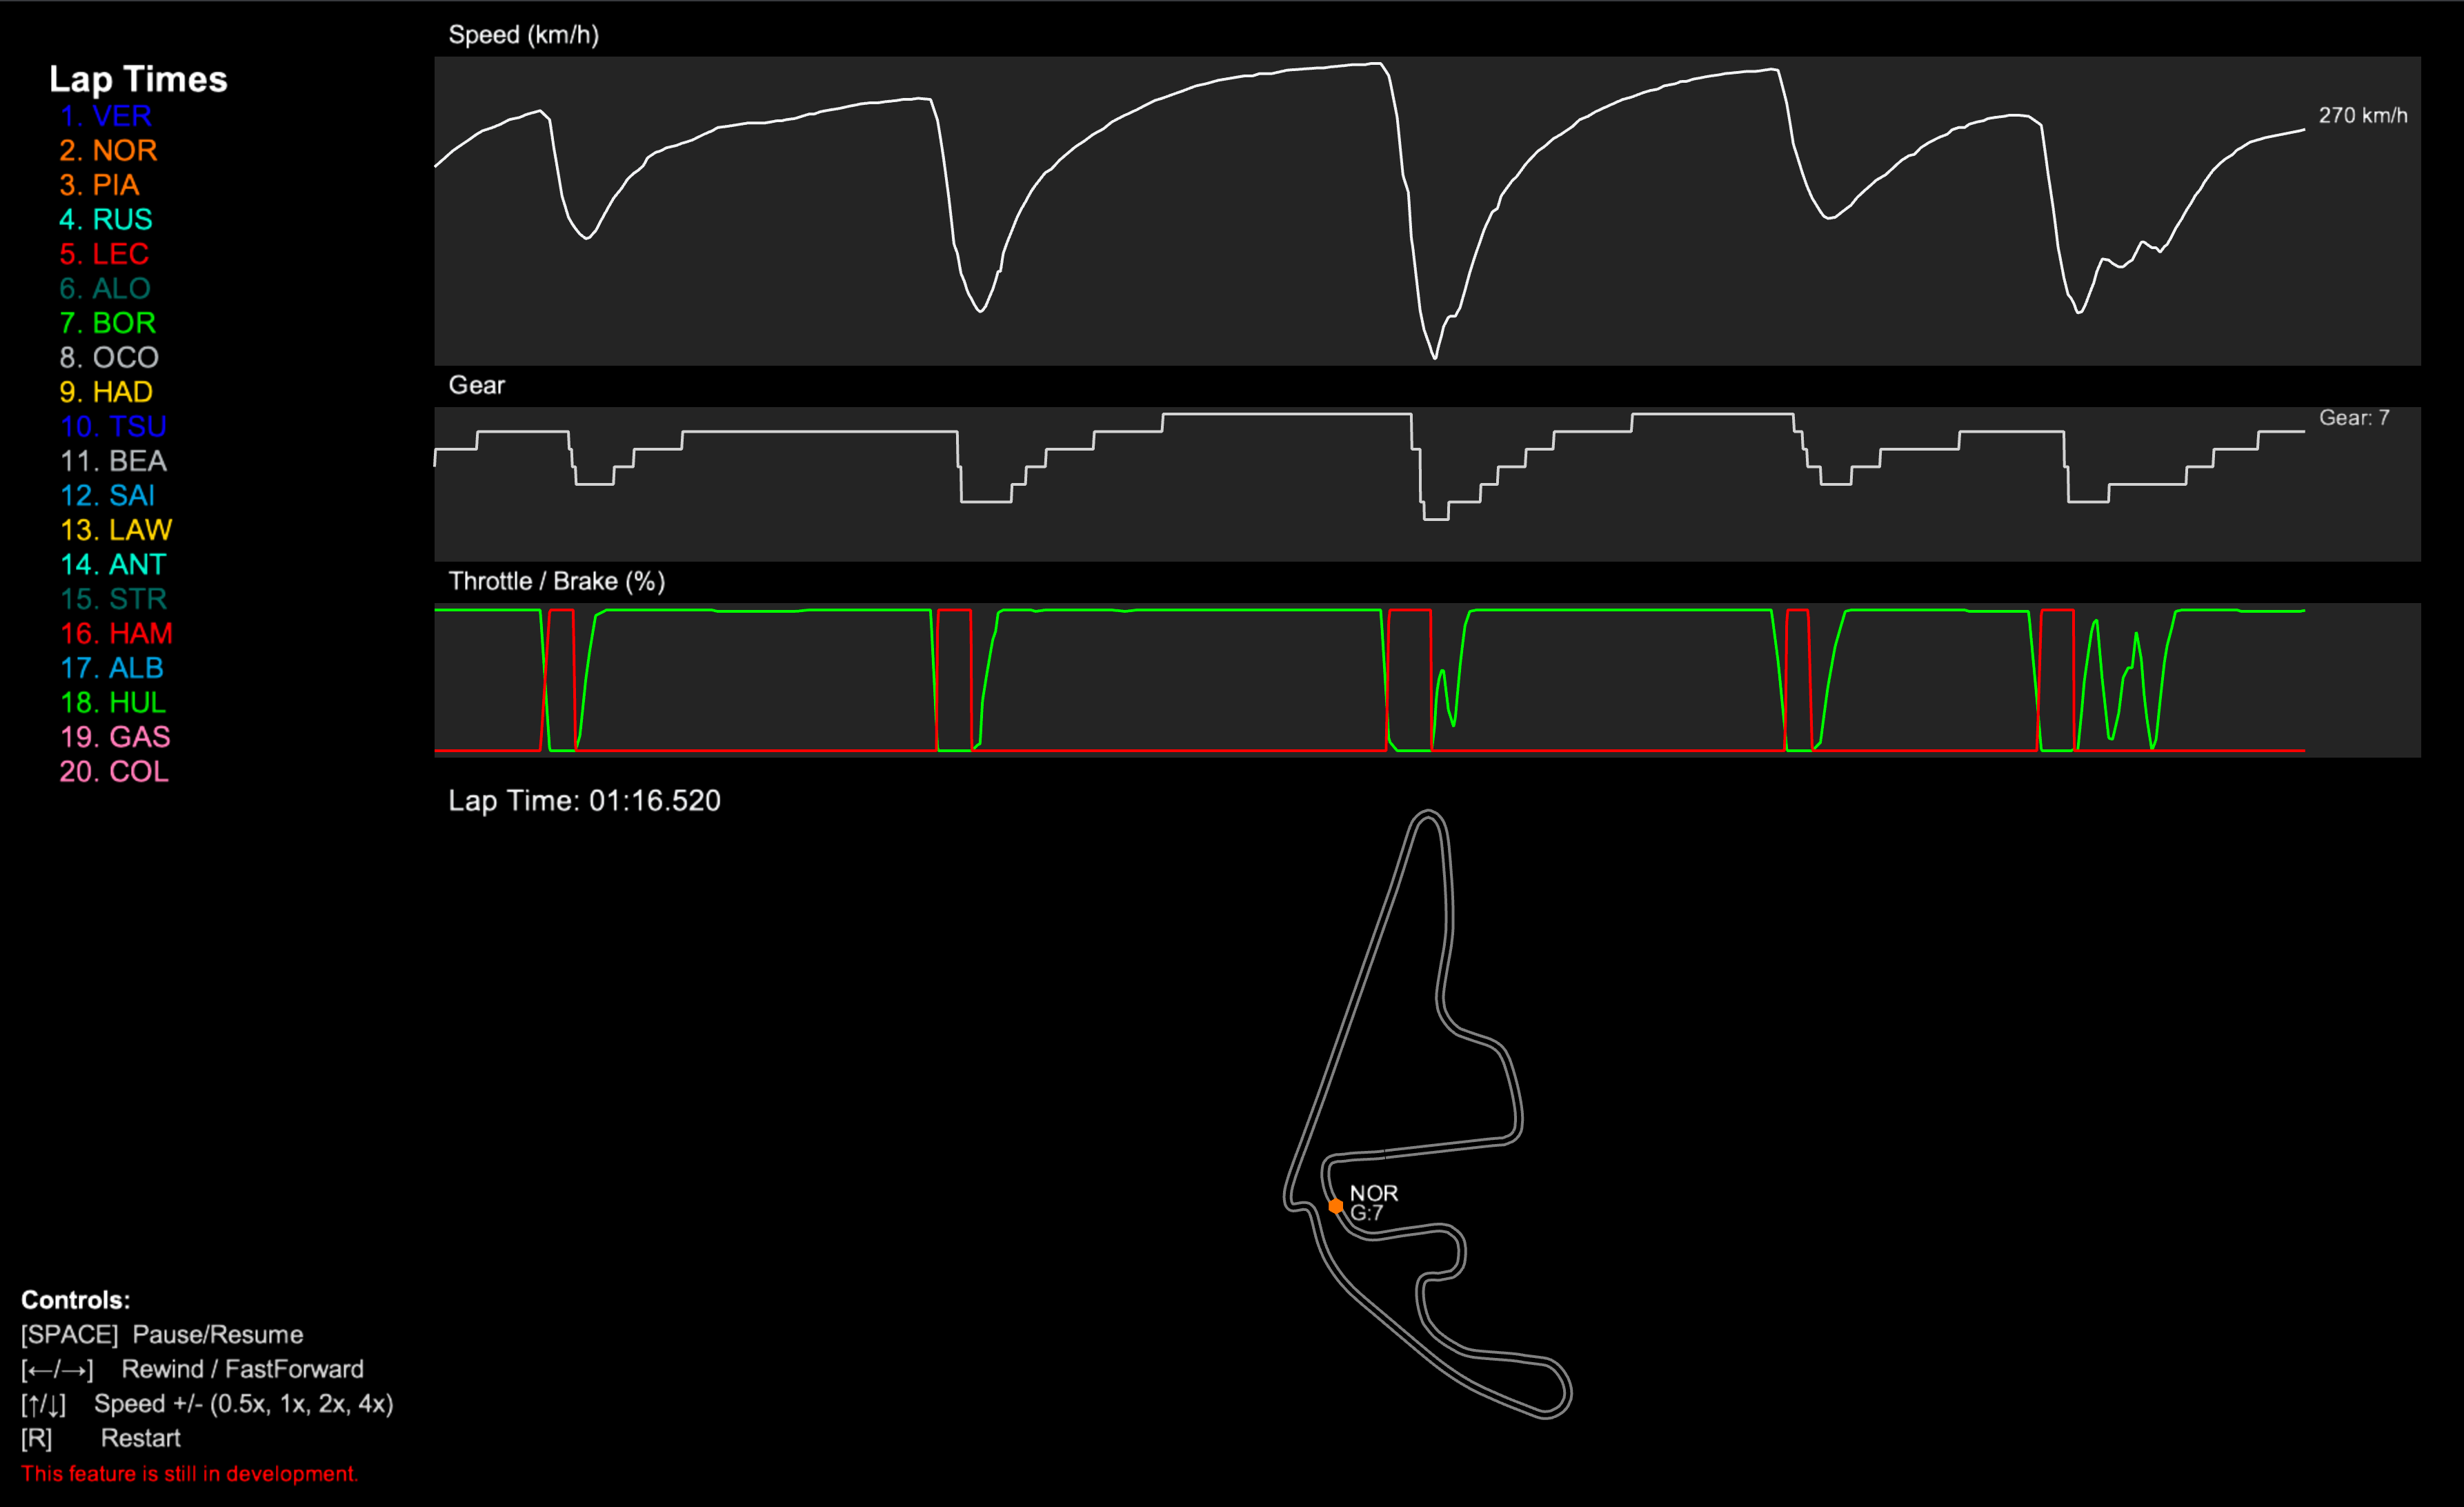
So to make sure that the tool gives the best insight into the drivers’ laps, I wanted users to be able to view the telemetry that showcases their speed, where they change gear, where they use the throttle and brakes, all plotted to show every little adjustment throughout the lap.
Introducing the “Telemetry Trace” Charts
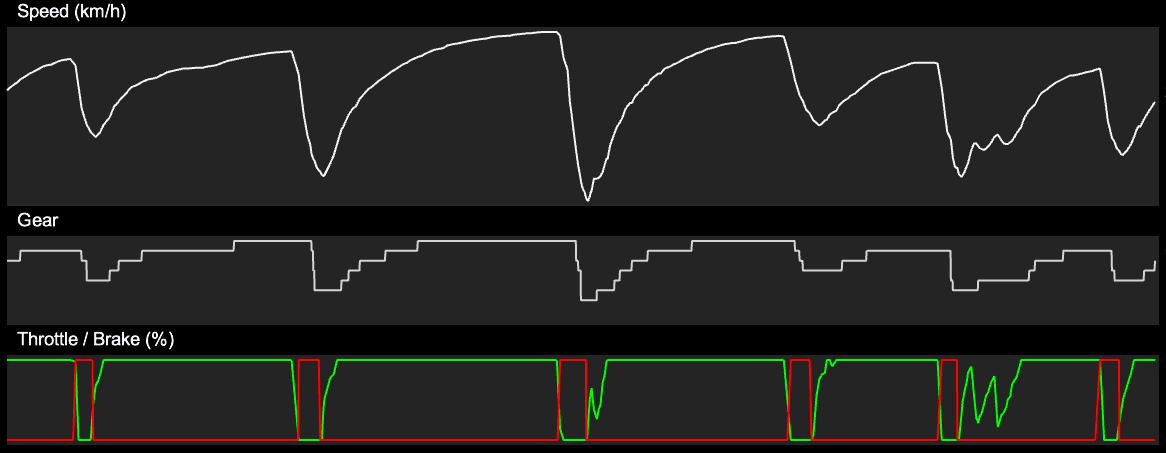
You’ve probably seen one of these before. They’re used by the engineers to understand how a driver is performing, often overlaid with another driver’s telemetry so that they can see where time is being gained or lost at different points around the track.
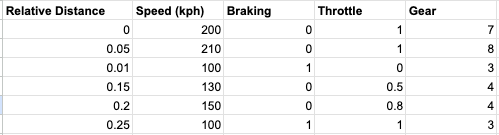
The concept is very simple, if you have a dataset which contains the distance that a car has travelled around the circuit, along with the parameters that you want to analyse, you’ll be able to plot the X axis with the distance and use the Y axis to plot any value in the telemetry.
Here’s an example of what that data could look like:
Adding this to F1 Race Replay
So how did this feature get introduced into the project?
Well first I had to do some cleaning up of the code. A little reorganising to make sure that it’s well kept and presentable for anyone that wants to download it and have a look at how it works.
The codebase now has the following structure:
f1-race-replay/
├── main.py                   # Entry point
├── requirements.txt          # Python dependencies
├── README.md                 # Project documentation
├── roadmap.md                # Planned features and project vision
├── resources/
│   └── preview.png           # Race replay preview image
├── src/
│   ├── f1_data.py            # Telemetry loading, processing, and frame generation
│   ├── arcade_replay.py      # UI starter logic
│   └── ui_components.py      # UI components like buttons and leaderboard
│   ├── interfaces/
│   │   └── qualifying.py     # Qualifying session interface (w/ chart)
│   │   └── race_replay.py    # Race replay interface
│   └── lib/
│       └── tyres.py          # Tyre formatting utilities
│       └── time.py           # Time formatting utilities
└── .fastf1-cache/            # FastF1 cache folder
└── computed_data/            # Computed telemetry data
The qualifying interface is completely separate from the race replay interface. So while they share some code similarities in terms of the UI, handling resizing, displaying the cars, etc, they’re very much separate features.
All of the data for this feature is sourced using the FastF1 Python package. And the interface is built using the Arcade Python package. Using a chart library probably would have been easier for this feature, however, embedding an interactive chart into an Arcade interface isn’t as easy… so I opted for creating the charts myself.
How to use the new feature
By passing the “—qualifying” argument when running the Python project, the application will process and display the qualifying data from the relevant race weekend that you select at runtime.
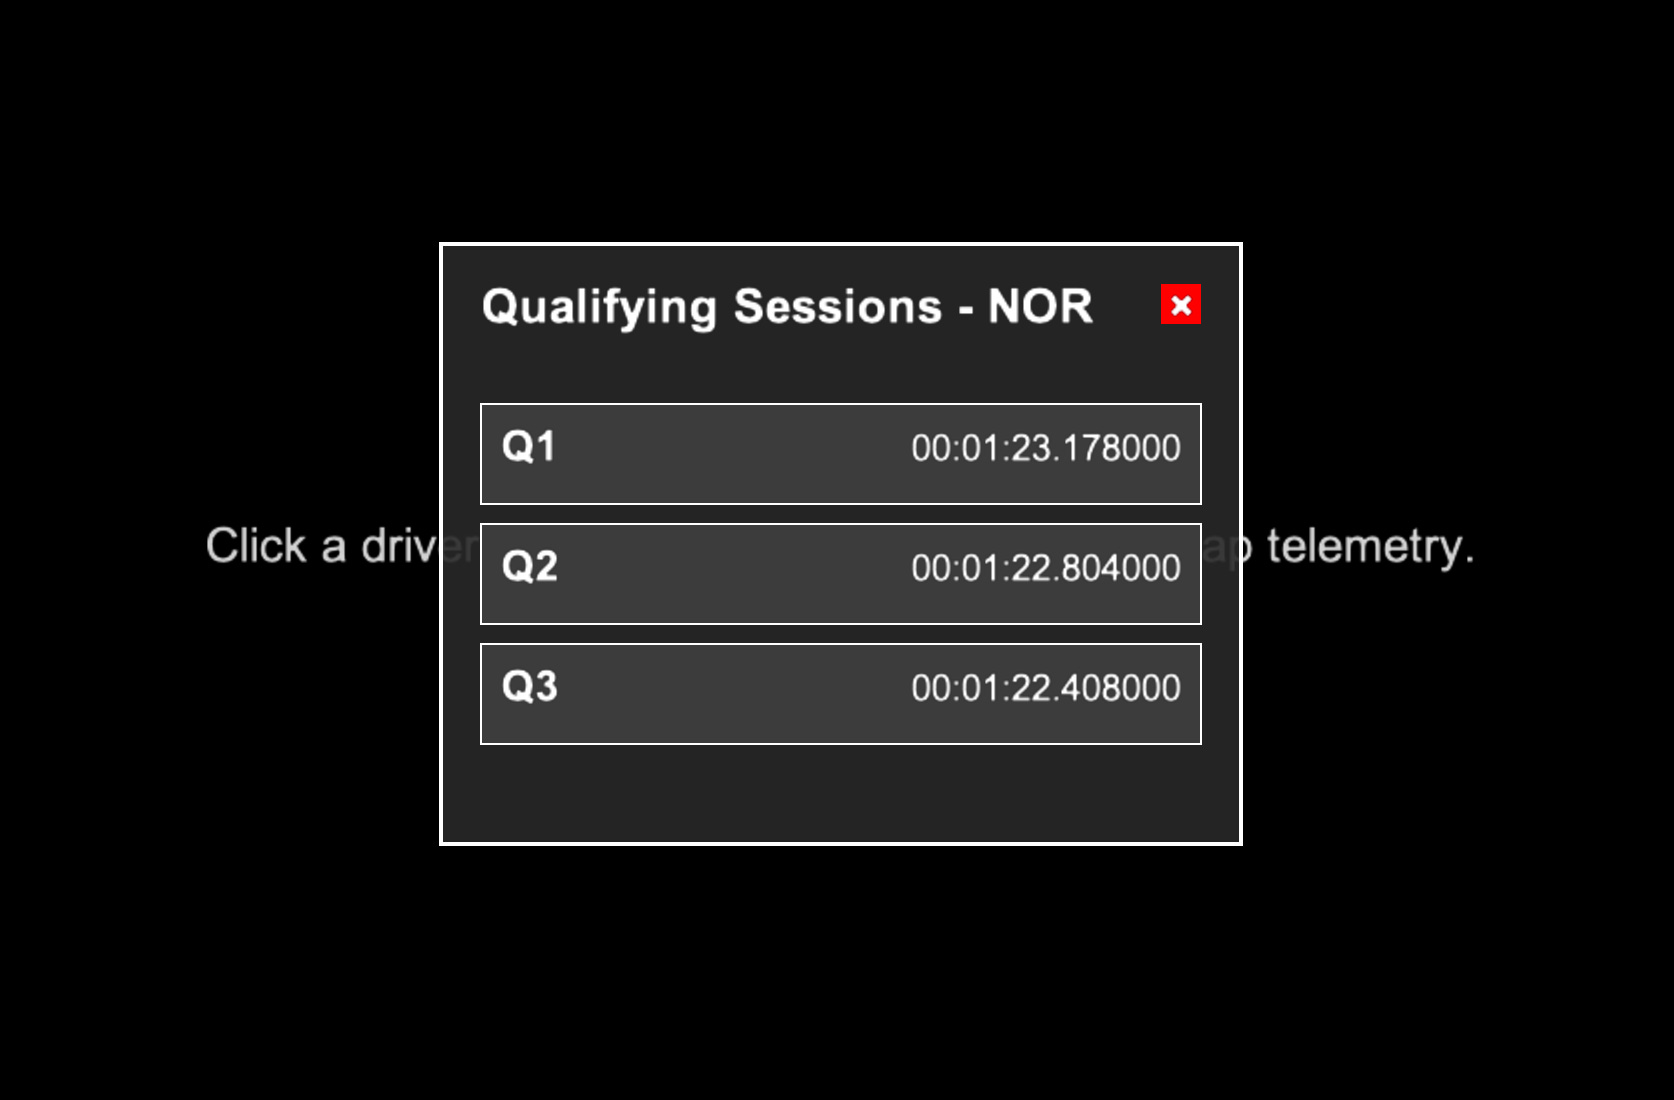
You will then be presented with a leaderboard screen where you can (using your mouse) select a driver and then select their lap telemetry from Q1, Q2 or Q3.
What’s next?
This feature is a really cool addition to the project, and I’m really excited to see the feedback that it gets from the community, but it’s definitely missing something… Comparison Tools.
As I mentioned earlier, these charts are often used to compare the performance of a driver with another driver. So without a doubt the next addition to this project has to be the ability to compare a driver’s telemetry with another driver.
For now though, you’ll have to wait for the comparison feature. In the meantime, check out the Qualifying Replay feature and have a think if there’s anything you’d like to add to the project. It’s open-source, so anyone can download it, add their own code and even submit a pull request to add their work into the main codebase for everyone to see!
You can access the code here: https://github.com/IAmTomShaw/f1-race-replay
Also, congratulations to Lando Norris on becoming the 2025 Formula 1 World Champion! 🏆